Hyderabad v2: the whole city
Area covered708.4 km²GHMC + Gandipet mandal
Tree cover15.2%107.9 km², WorldCover 2021
Vegetation 202517.0%2020: 15.1%
Localities168149 GHMC wards + 19 others
| Res 10 verdict | Hexes | km² |
|---|---|---|
| Green | 8,841 | 136.3 |
| Moderate | 4,052 | 62.4 |
| Grey | 33,075 | 509.7 |
Hexes: 1,096 at res 8 · 6,896 at res 9 · 45,968 at res 10. Built-up land covers 57.9% of the area.
Greenest localities
| # | Locality | Tree | Veg 2025 | km² |
|---|---|---|---|---|
| 1 | Osmania University | 66.0% | 54.4% | 4.46 |
| 2 | Balanagar | 47.7% | 40.4% | 7.17 |
| 3 | Kanchanbagh | 42.7% | 36.5% | 5.08 |
| 4 | Langar Houz | 42.5% | 34.6% | 6.90 |
| 5 | Ramnaspura | 40.3% | 35.5% | 2.81 |
Greyest localities
| # | Locality | Tree | Veg 2025 | km² |
|---|---|---|---|---|
| 168 | Talab Chanchalam | 0.3% | 0.6% | 0.63 |
| 167 | Moghalpura | 0.6% | 3.7% | 0.83 |
| 166 | Boudha Nagar | 0.7% | 3.2% | 0.83 |
| 165 | Rein Bazar | 0.7% | 2.7% | 0.65 |
| 164 | Seethaphalmandi | 0.9% | 5.1% | 1.05 |
- Coverage boundary: the GHMC boundary from OpenStreetMap (relation 7868535, admin_level 8) plus Gandipet mandal (relation 9832908), which brings in Kokapet, Narsingi, Manikonda and the Financial District. The area added to GHMC in 2025 isn't in OSM yet, so it's not included.
- Localities:
- 149 GHMC ward polygons from OSM (admin_level 10). Ward 119 is missing in OSM.
- 4 GHMC gap pieces, each named after the OSM area or place node it overlaps.
- 15 Voronoi cells around OSM suburb and village nodes, clipped to the area outside GHMC. These are approximations, not official boundaries.
- Imagery:
- Sentinel-2 L2A from tile 44QKE, Jan–Apr median composites: 20 scenes for 2025 and 16 for 2020.
- Vegetation means NDVI above 0.4.
- Tree cover comes from ESA WorldCover 2021.
- Res 9 and res 8 hexes are area-weighted rollups of res 10.
- Search:
- A static index of 16,962 named OpenStreetMap places, 5,985 of which have footprints.
- Each footprint is scored as the area-weighted average of the res 10 hexes it overlaps.
- If a place isn't in the index, a live Nominatim lookup is offered, limited to Hyderabad.
The idea
- Hex grid: any area is tiled with H3 hexagons. Resolution 8 is about 0.7 km², a neighbourhood-sized cell.
- Resident first: each hex gets a clear verdict, its rank within the city, and a multi-year trend.
- Builder spin-off: density and greenery can coexist. Tree-lined streets, podium gardens and green roofs show up from above, so projects in green hexes, or ones that raise their hex's score, can prove it.
- Policy hook: ward-level report cards and a yearly "greenest and greyest wards" ranking.
Scoring
| Metric | Source | Definition |
|---|---|---|
| Vegetation % | Sentinel-2 L2A (10 m) | Share of pixels with NDVI above 0.4 in a clear-sky seasonal median. Clouds and shadows are masked out. Water, paint and turf aren't counted as green. |
| Tree cover % | ESA WorldCover 10 m | Share of pixels classified as "Tree cover" |
| Verdict | Tree cover % | Green above 30% (the 3-30-300 rule) · Moderate 15–30% · Grey below 15% |
| Context and trend | - | Ranked within the city. Compared with about 5 years ago in the same season. |
Res 8 (about 0.7 km²) gives the fair neighbourhood verdict. Res 10 (about 0.015 km², around 190 pixels per hex) is the block-level drill-down that shows where to plant.
Strategy, cadence and cost
- Cities first: design the pipeline for the whole world, but launch city by city, going deep on 5–10 Indian cities with ward boundaries and policy hooks.
- Cadence: Sentinel-2 passes over every place about every 5 days, but monsoon clouds rule out using every image. Seasonal and annual composites are used instead, with optional quarterly alerts for clearing.
- Rough cost: imagery is free. Compute is a few hundred to a few thousand USD a year. Storage and CDN serving are close to nothing. Commercial high-resolution imagery should be avoided at global scale.
Pilot: Odaiba (Tokyo) vs Kokapet (Hyderabad)
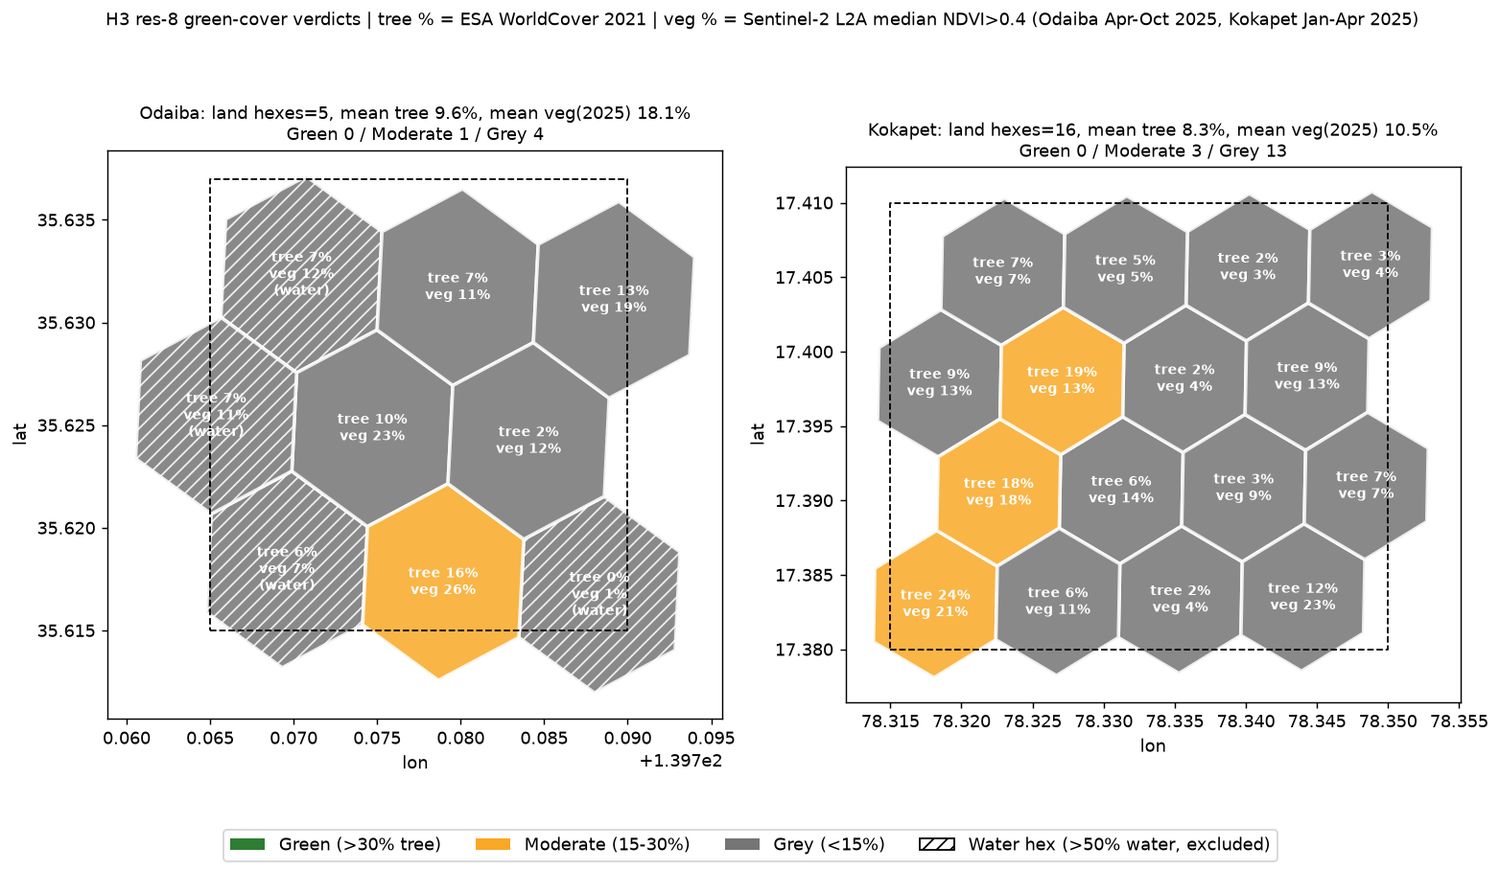
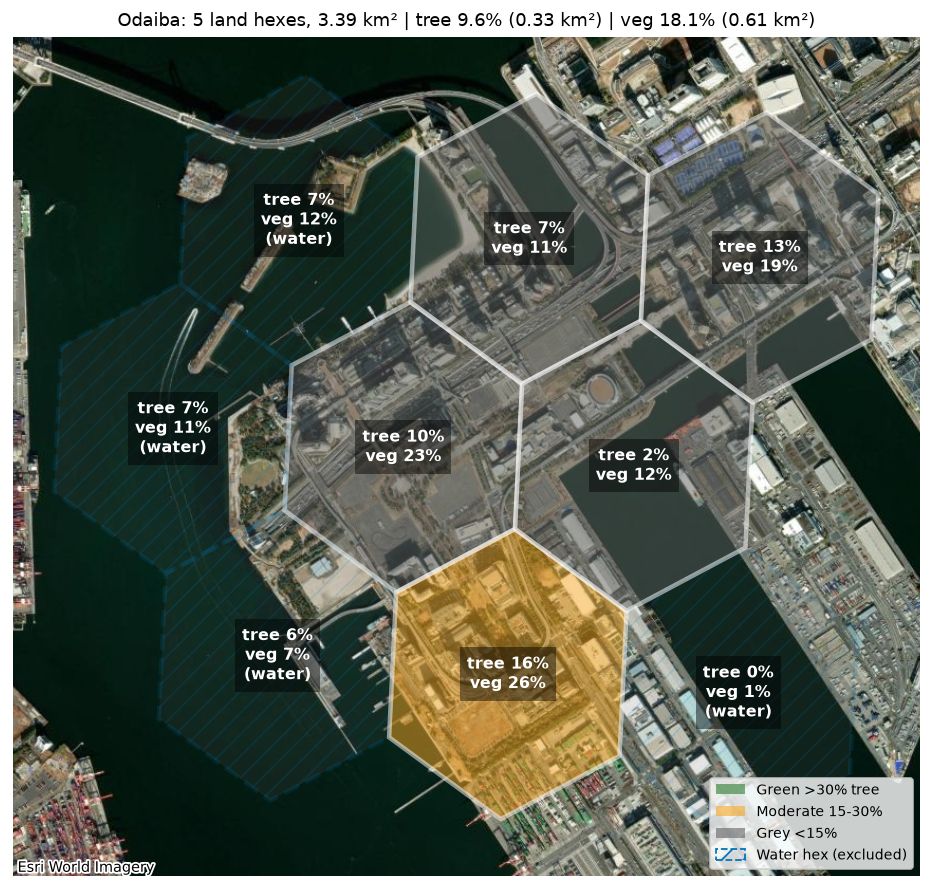
Odaiba tree cover9.6%5 land hexes · 3.39 km²
Odaiba vegetation18.1%Apr–Oct 2025, 9 scenes
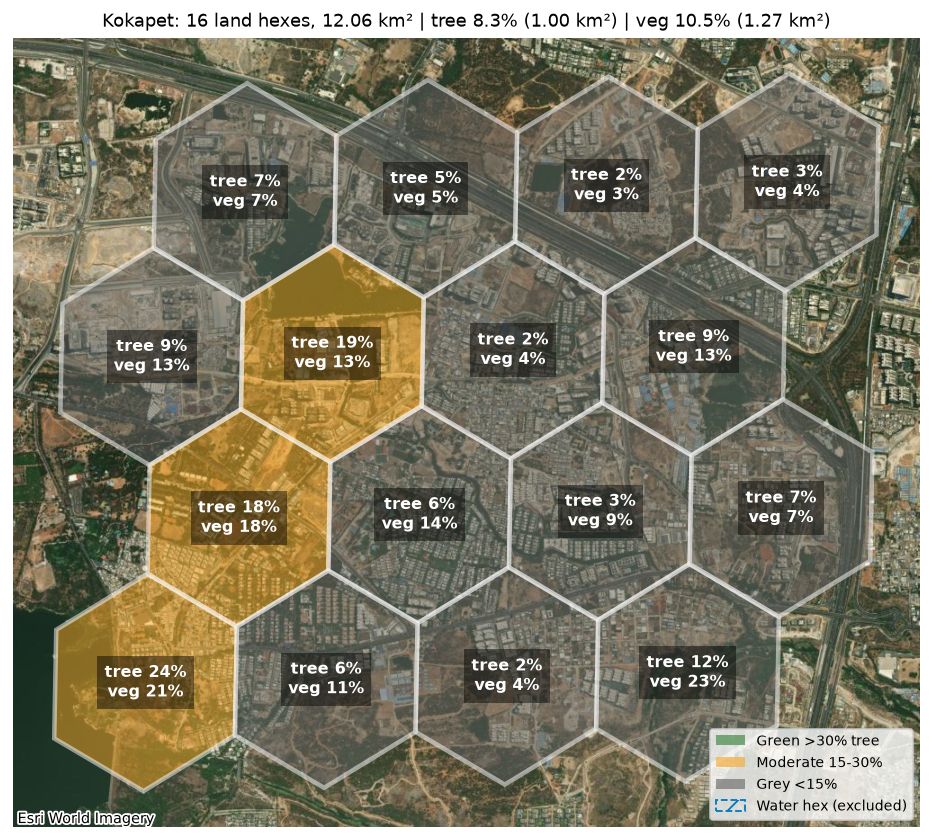
Kokapet tree cover8.3%16 hexes · 12.06 km²
Kokapet vegetation10.5%Jan–Apr 2025, 20 scenes
| Res 8 | Odaiba | Kokapet |
|---|---|---|
| Green / Moderate / Grey | 0 / 1 / 4 | 0 / 3 / 13 |
| Vegetation 2020 → 2025 | 13.4% → 18.1% | 6.5% → 10.5% |
| Built-up | 2.26 km² | 4.43 km² |
| Grass / bare | 0.08 / 0.07 km² | 3.17 / 1.66 km² |
| Bounding box | 139.765–139.790 E, 35.615–35.637 N | 78.315–78.350 E, 17.380–17.410 N |
Result: both areas are mostly Grey. Odaiba is slightly greener per km² of land (4 water hexes excluded).
Kokapet drill-down (H3 res 10)
784 hexes averaging about 15,400 m² each. The area-weighted totals still match the res 8 result: 8.4% tree and 10.6% vegetation.
| Verdict | Hexes | Area |
|---|---|---|
| Green | 72 | 1.11 km² |
| Moderate | 75 | 1.15 km² |
| Grey | 637 | 9.80 km² (81%) |
- Tree % per hex: the median is 0.5%, and 426 hexes are below 1%. The top 5% of hexes are above 43.8%.
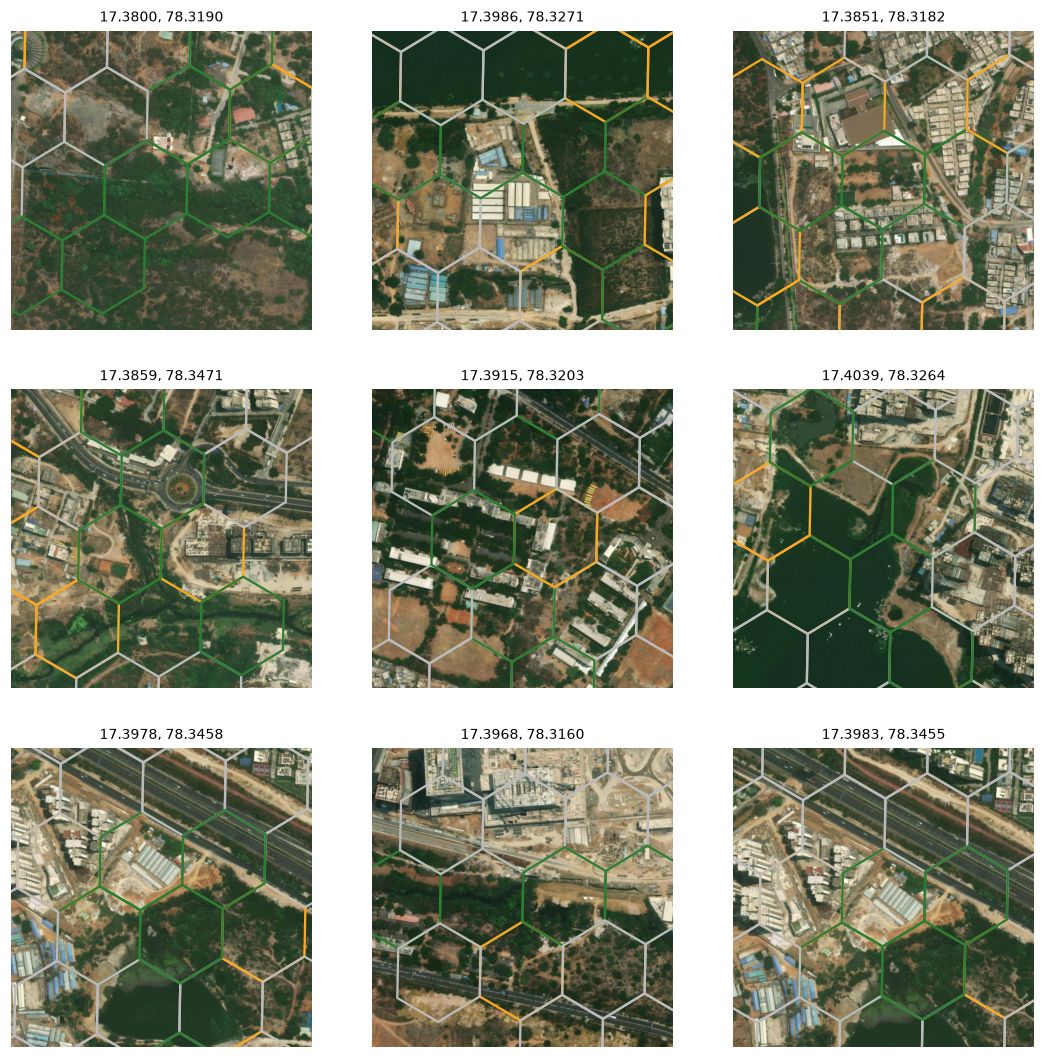
- Best pocket: the south-west edge around 17.3800, 78.3190. 8 Green hexes averaging 74.5% tree and 59% vegetation.
- Density and green together: around 17.3915, 78.3203 there's a zone that is 52% built-up and still about 30% tree.
- Largest dead zone: north and centre-north around 17.4017, 78.3355. 4.03 km² at 0.1% tree.
- Likely cleared since 2021: 7 hexes (0.11 km²) had more than 30% trees in 2021 but less than 10% vegetation in 2025.
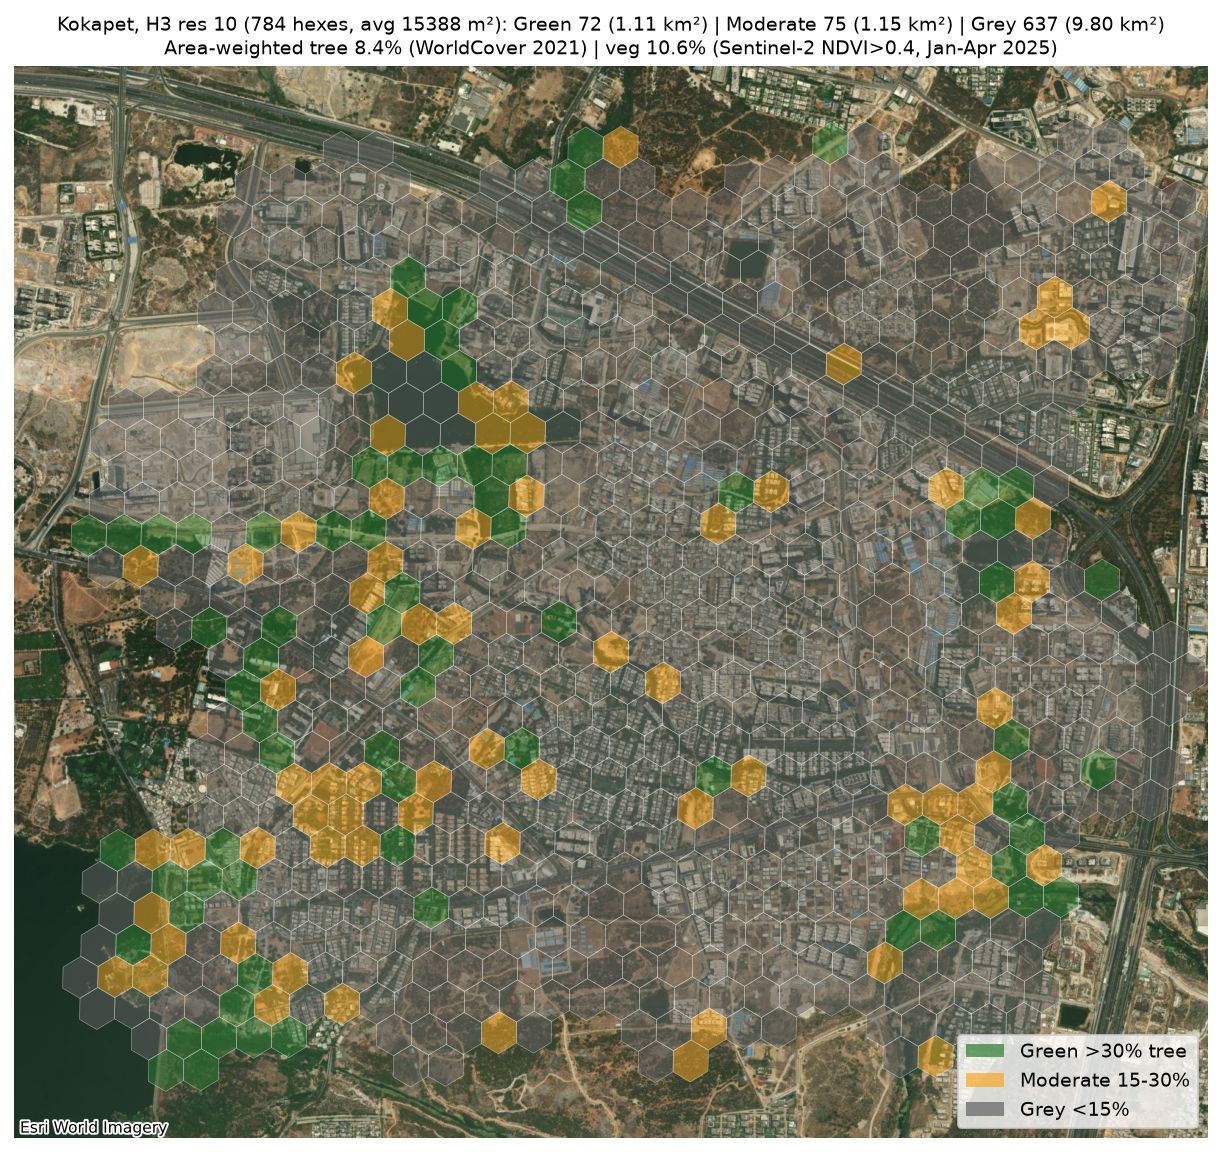
Open interactive res-10 map → (about 1.5 MB)
Satellite close-ups of the top pockets
Caveats
- ESA WorldCover is from 2021, and Kokapet has changed fast since then. Real tree cover today is likely at or below 8.4%.
- The 2020 → 2025 trend is two snapshots, so rainfall, regrowth and new landscaping all affect it.
- Seasons differ: Odaiba is measured leaf-on and Kokapet in its dry season. H3 hex area also varies by latitude.
- The Hyderabad map uses the same pipeline. Its rankings depend on the locality boundaries: ward polygons are OSM's, and the outer localities are Voronoi approximations.
- Res 10 is at the edge of what 10 m data supports, and res 11 is noise. Basemap imagery dates are unknown.
Data
Sentinel-2 L2A (ESA Copernicus, via Microsoft Planetary Computer) · ESA WorldCover 2021 v200 · H3 · OpenStreetMap · Esri World Imagery.
Per-hex results: res 8 · areas · res 10/11 · pockets